
Data Collector Sets

Introduction
Data Collector Sets were added to the Performance Monitor tool with the release of Windows Vista. They provide an easy way to capture a systems overall performance and also a way to generate alerts when an unfavorable condition occurs, such as running out of disk space.
What are Data Collector Sets?
Data Collector Sets are part of the Performance Monitor tool. It provides an automated way to capture a systems overall performance. It monitors the four subsystems, Processor, Network, Disk and Memory. It allows you to configure and schedule performance counter, event trace, and configuration data collection so that you can analyze the results and view performance reports. It can also be configured to generate alerts when thresholds are reached, such as running out of disk space or high processor utilization.
How to Use Data Collector Sets
In our example today, we will create a Data Collector Set to establish a simple performance baseline. Performance baselines provide a way for us to compare current performance conditions with a known performance condition that existed in the past, such as when the machine was introduced into production.
When I build a new machine I create one of these simple baselines so I have a report of the machines performance on day one of its lifecycle. Over time, as changes occur in the environment, such as additional software, utilities and patches being installed, the performance conditions of the machine will change.
I can re-run the Data Collector Set that I originally created and generate a new performance report with current values. Now I have two performance reports about the machine. The first report generated on the first day of production and a new report that captures the performance conditions that are occurring now.
As I compare the reports I notice that some of the performance counters that are captured are significantly different from the baseline (the original capture). This will provide information on what subsystem is affected and where the performance bottleneck is occurring and I can take steps to address the issue such as adding additional memory, adding faster disks, offloading services to another machine, etc.
How to Configure a Data Collector Set
To configure your Data Collector Set follow these steps:
- Open the Performance Monitor tool. It can be found in Administrative Tools in Control Panel.
- Expand the Data Collector Sets node. We will be creating a User Defined Data Collector Set.
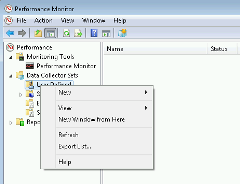
- Choose New, Data Collector Set to start the wizard.
- Name your Data Collector Set and choose Create from a template (Recommended). Note: To create an alert for a performance condition you would choose Create manually (Advanced).
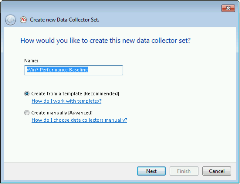
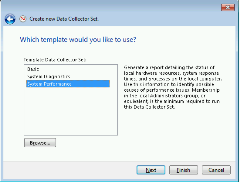
- Choose the System Performance template and click Next.
- On the “Where would you like the data to be saved?” page, click Next.
- On the “Create the data collector set?” page, leave the default selection and click Finish.
You will now have your Data Collector Set created and it will be in a Stopped state. If you go to the properties of your Data Collector Set you will see various settings that you can configure.
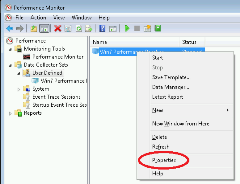
Let’s focus on the Stop Condition tab. Notice that the Overall duration is set to one minute, by default. This performance capture will analyze the machine for one minute and then produce the performance report.

Next, let’s start the newly created Data Collector Set.
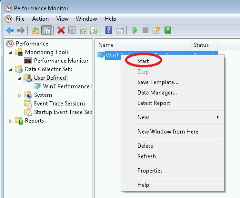
After one minute, the Data Collector Set compiles the report and then stops.
Now we have a performance report. Navigate to the Reports node of the Performance Monitor tool. Under the section User Defined, we will find our report.
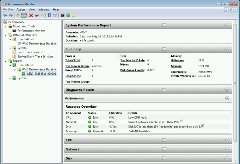
The report provides a multitude of details about the systems performance of the four subsystems, Processor, Network, Disk and Memory. The report also includes important information, such as when the report was run and overall specifications of the machine including total CPUs, Disk IO/sec, Memory Utilization and much more.
Conclusion
Data Collector Sets are an easy way to establish a simple performance baseline and can help identify performance bottlenecks.
Suggested Classes
Additional Resources
Technet:
https://technet.microsoft.com/en-us/library/cc749337.aspx
Computer Performance:
https://www.computerperformance.co.uk/windows7/windows7_data_collector_set.htm
